Do stocks outperform Treasury bills?
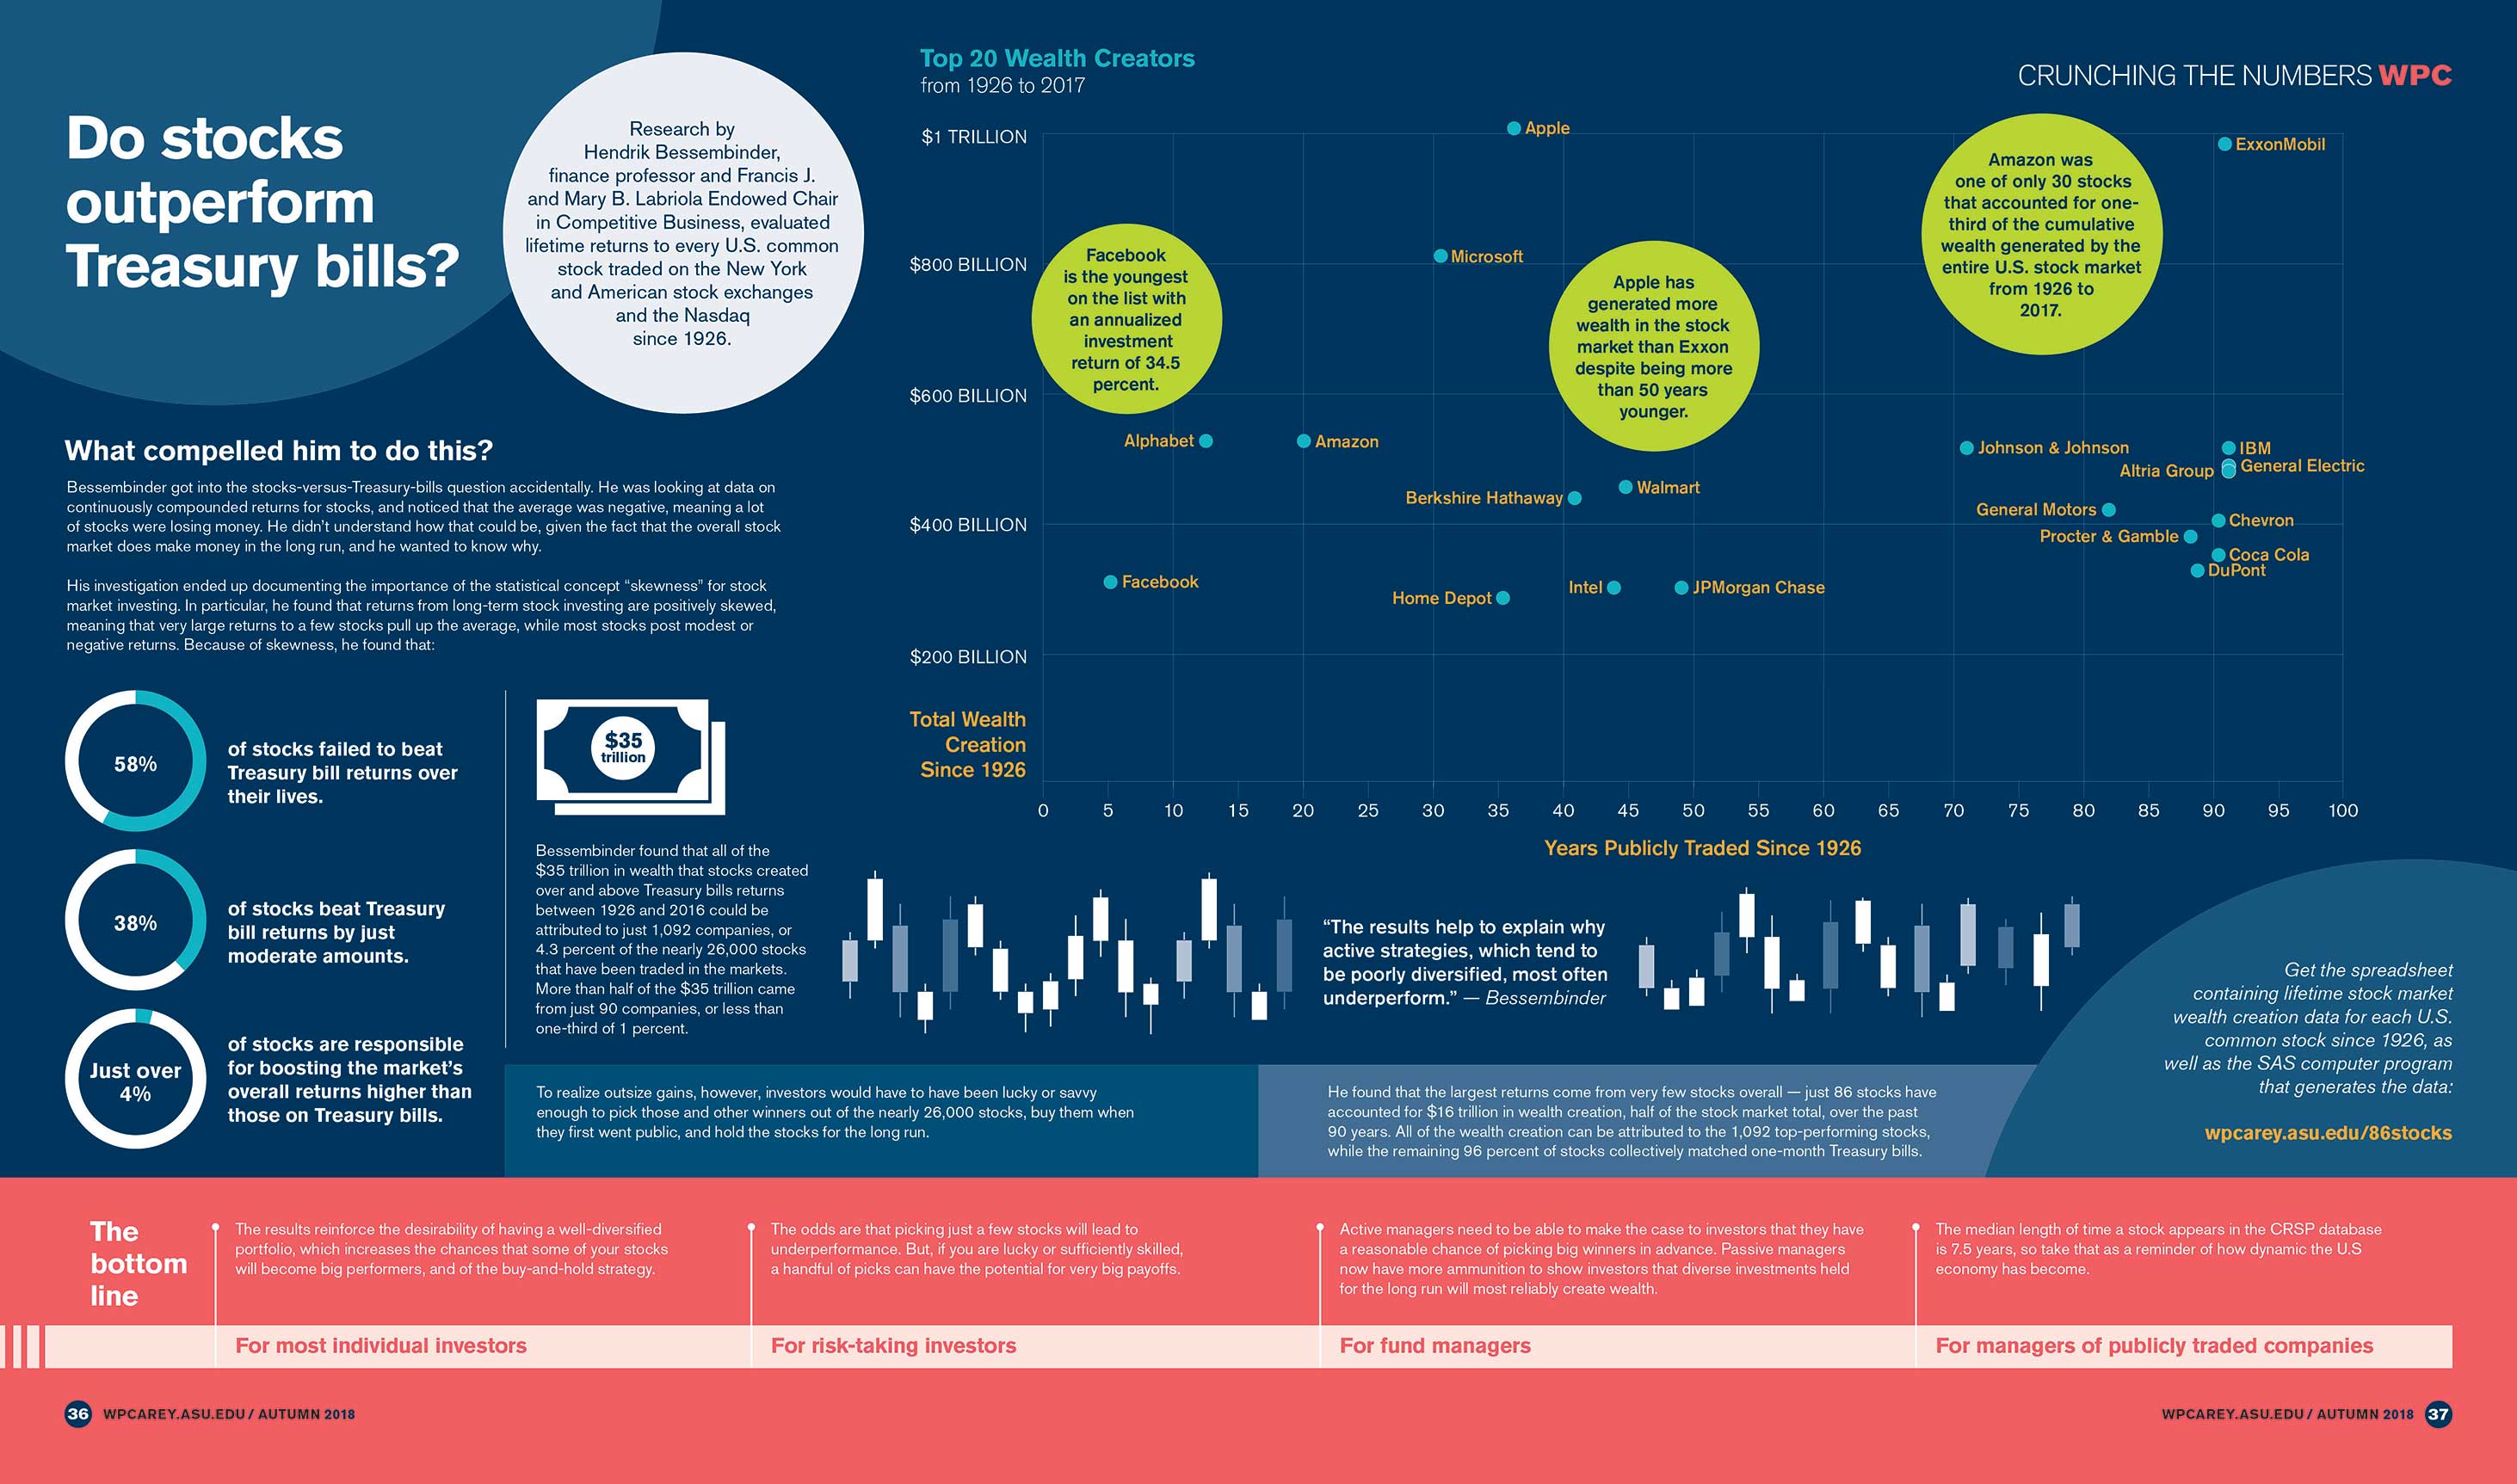
Research by Hendrik Bessembinder, professor and Francis J. and Mary B. Labriola Endowed Chair in Competitive Business at ASU’s W. P. Carey School of Business, evaluated lifetime returns to every U.S. common stock traded on the New York and American stock exchanges and the Nasdaq since 1926.
Key findings
“The results also help to explain why active strategies, which tend to be poorly diversified, most often underperform,” says Bessembinder, who found that the largest returns come from very few stocks overall — just 86 stocks have accounted for $16 trillion in wealth creation, half of the stock market total, over the past 90 years. All of the wealth creation can be attributed to the thousand top-performing stocks, while the remaining 96 percent of stocks collectively matched one-month T-bills.
Bessembinder’s groundbreaking research has been covered extensively in major news outlets. He made available a spreadsheet containing lifetime stock market wealth creation data for each U.S. common stock since 1926, as well as the SAS computer program that generates the data, featured below.
2019 update to wealth creation calculation
Using data to December 2019, the update finds that net wealth creation in the U.S. public stock markets since 1926 increased from $34.824 trillion as of December 2016 to $47.381 trillion. The concentration of wealth creation also increased.
Read the research
Long-run returns, 1926 to 2023
This study quantifies compound returns to over 29,000 stocks since 1926. A spreadsheet that reports returns for each stock can be downloaded.
The global evidence
This study assesses compound returns to over 64,000 global common stocks from 1991 to 2020, showing that the majority, 55.2% of U.S. stocks and 57.4% of non-U.S. stocks, underperform one-month U.S. Treasury bills over the full sample. Further, the top-performing 2.4% of firms account for all of the US $75.7 trillion in net global stock market wealth creation during the thirty-year period.
Also, updated outcomes, based on methods described in the paper, but including return data through 2022, are available to download.
News and media coverage
- Hot stocks can make you rich, but they probably won’t — The New York Times
- The mind-boggling ascent of Amazon and Jeff Bezos — The New York Times
- The best investment since 1926? Apple — The New York Times
- Picking stocks is hard. It’s harder with growth. — Bloomberg
- Lesson of the century: Most U.S. stocks can’t even beat a T-bill — Bloomberg
- So few market winners, so much dead weight — Bloomberg
- In age of 'superstar firms,' index investing logic holds — Reuters
- Individual stocks don’t even beat Treasury bills — Reuters
- Why picking stocks is only slightly better than playing the lottery — MarketWatch
- Here’s why you shouldn’t buy a stock ever again — MarketWatch
- Amazon’s 49,000% gain: the most ‘super’ of ‘superstocks’ since 1926 — The Wall Street Journal
- Needles in a stock picker’s haystack: Can you find the 4%? — Huffington Post
- Dans la moitié des cas, les actions font perdre de l’argent — Le Monde
Research tools
- Spreadsheet — U.S. public stock market wealth creation by company, measured as of Dec. 31, 2016
- Updated spreadsheet — U.S. public stock market wealth creation by company, measured as of Dec. 31, 2019
- Updated spreadsheet — U.S. public stock market wealth creation by company, measured as of Dec. 31, 2022
- Updated spreadsheet — U.S. public stock market wealth creation by company, measured as of Dec. 31, 2024
- SAS program — to generate wealth creation outcomes
The SAS program measures wealth creation on the basis of past stock market prices and returns, as described in the paper "Do stocks outperform Treasury bills?" The program requires as input monthly stock return data from the Center for Research in Security Prices (CRSP) at the University of Chicago. Companies are identified based on the “Permco” variable assigned by CRSP, and the company name listed in the spreadsheet is that most recently associated with the Permco by CRSP. The first and last months listed in the spreadsheet identify the earliest and latest months for which the CRSP database contains return data for the Permco, except that the earliest month never precedes July 1926. For companies with multiple share classes, wealth creation is computed separately for each class (CRSP permno), and summed across classes.
Top 20 wealth creators from 1926 to 2017
If most stocks are underperforming, yet the market as a whole does well, the only way these two things can come together is that there are a few stocks doing really well that pull the whole market up. Click the infographic to see the the top 20 winning stocks.
Questions regarding the CRSP data or CRSP’s assignments of the permno and permco variables should be directed to CRSP.